 Web Server Statistics for blog.soshiaweb.ir
Program started on Tue, Nov 26 2024 at 12:13 PM.
Analyzed requests from Tue, Jul 02 2024 at 5:23 PM to Tue, Nov 26 2024 at 4:13 AM (146.45 days).
Web Server Statistics for blog.soshiaweb.irProgram started on Tue, Nov 26 2024 at 12:13 PM.
Analyzed requests from Tue, Jul 02 2024 at 5:23 PM to Tue, Nov 26 2024 at 4:13 AM (146.45 days).
(Go To: Top | General Summary | Monthly Report | Daily Summary | Hourly Summary | Domain Report | Organization Report | Redirected Referrer Report | Failed Referrer Report | Referring Site Report | Browser Report | Browser Summary | Operating System Report | Status Code Report | File Size Report | File Type Report | Directory Report | Request Report)
Figures in parentheses refer to the 7-day period ending Nov 26 2024 at 12:13 PM.
Successful requests: 719 (0)
Average successful requests per day: 4
Successful requests for pages: 23 (0)
Failed requests: 271 (0)
Redirected requests: 300 (1)
Distinct files requested: 613 (2)
Distinct hosts served: 264 (1)
Data transferred: 135.23 kilobytes (0 bytes)
Average data transferred per day: 945 bytes (0 bytes)
(Go To: Top | General Summary | Monthly Report | Daily Summary | Hourly Summary | Domain Report | Organization Report | Redirected Referrer Report | Failed Referrer Report | Referring Site Report | Browser Report | Browser Summary | Operating System Report | Status Code Report | File Size Report | File Type Report | Directory Report | Request Report)
Each unit ( ) represents 1 request for a page.
| month | #reqs | #pages | |
|---|---|---|---|
| Jul 2024 | 330 | 13 |   |
| Aug 2024 | 254 | 3 |  |
| Sep 2024 | 79 | 4 | |
| Oct 2024 | 1 | 1 | |
| Nov 2024 | 55 | 2 | |
Busiest month: Jul 2024 (13 requests for pages).
(Go To: Top | General Summary | Monthly Report | Daily Summary | Hourly Summary | Domain Report | Organization Report | Redirected Referrer Report | Failed Referrer Report | Referring Site Report | Browser Report | Browser Summary | Operating System Report | Status Code Report | File Size Report | File Type Report | Directory Report | Request Report)
Each unit () represents 1 request for a page.
| day | #reqs | #pages | |
|---|---|---|---|
| Sun | 86 | 0 | |
| Mon | 136 | 2 | |
| Tue | 80 | 4 | |
| Wed | 94 | 3 | |
| Thu | 86 | 4 | |
| Fri | 95 | 7 | |
| Sat | 142 | 3 | |
(Go To: Top | General Summary | Monthly Report | Daily Summary | Hourly Summary | Domain Report | Organization Report | Redirected Referrer Report | Failed Referrer Report | Referring Site Report | Browser Report | Browser Summary | Operating System Report | Status Code Report | File Size Report | File Type Report | Directory Report | Request Report)
Each unit () represents 1 request for a page.
| hour | #reqs | #pages | |
|---|---|---|---|
| 0 | 8 | 4 | |
| 1 | 2 | 1 | |
| 2 | 64 | 1 | |
| 3 | 1 | 1 | |
| 4 | 4 | 2 | |
| 5 | 72 | 1 | |
| 6 | 8 | 4 | |
| 7 | 1 | 0 | |
| 8 | 63 | 0 | |
| 9 | 10 | 3 | |
| 10 | 4 | 1 | |
| 11 | 63 | 0 | |
| 12 | 2 | 0 | |
| 13 | 58 | 0 | |
| 14 | 117 | 0 | |
| 15 | 3 | 0 | |
| 16 | 9 | 2 | |
| 17 | 78 | 1 | |
| 18 | 1 | 0 | |
| 19 | 4 | 0 | |
| 20 | 66 | 0 | |
| 21 | 9 | 0 | |
| 22 | 8 | 2 | |
| 23 | 64 | 0 |
(Go To: Top | General Summary | Monthly Report | Daily Summary | Hourly Summary | Domain Report | Organization Report | Redirected Referrer Report | Failed Referrer Report | Referring Site Report | Browser Report | Browser Summary | Operating System Report | Status Code Report | File Size Report | File Type Report | Directory Report | Request Report)
Listing domains, sorted by the amount of traffic.
| #reqs | %bytes | domain |
|---|---|---|
| 719 | 100% | [unresolved numerical addresses] |
(Go To: Top | General Summary | Monthly Report | Daily Summary | Hourly Summary | Domain Report | Organization Report | Redirected Referrer Report | Failed Referrer Report | Referring Site Report | Browser Report | Browser Summary | Operating System Report | Status Code Report | File Size Report | File Type Report | Directory Report | Request Report)
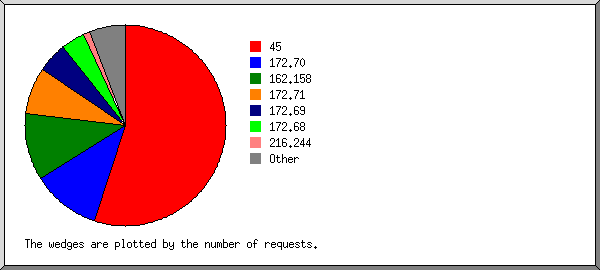
Listing the top 20 organizations by the number of requests, sorted by the number of requests.
| #reqs | %bytes | organization |
|---|---|---|
| 395 | 15.91% | 45 |
| 79 | 3.84% | 172.70 |
| 78 | 3.88% | 162.158 |
| 55 | 2.76% | 172.71 |
| 35 | 1.68% | 172.69 |
| 28 | 1.45% | 172.68 |
| 8 | 0.97% | 216.244 |
| 4 | 0.18% | 188.114 |
| 3 | 0.17% | 108 |
| 2 | 14.00% | 97 |
| 2 | 14.00% | 185.104 |
| 2 | 12.22% | 148.72 |
| 2 | 0.18% | 136.243 |
| 2 | 2.51% | 139.162 |
| 2 | 0.17% | 35 |
| 2 | 2.54% | 139.59 |
| 2 | 2.54% | 165.227 |
| 2 | 1.45% | 46 |
| 2 | 12.22% | 162.0 |
| 1 | 0.08% | 16 |
| 13 | 7.23% | [not listed: 13 organizations] |
(Go To: Top | General Summary | Monthly Report | Daily Summary | Hourly Summary | Domain Report | Organization Report | Redirected Referrer Report | Failed Referrer Report | Referring Site Report | Browser Report | Browser Summary | Operating System Report | Status Code Report | File Size Report | File Type Report | Directory Report | Request Report)
Listing referring URLs, sorted by the number of redirected requests.
| #reqs | URL |
|---|---|
| 1 | https://www.netcraft.com/survey/ |
(Go To: Top | General Summary | Monthly Report | Daily Summary | Hourly Summary | Domain Report | Organization Report | Redirected Referrer Report | Failed Referrer Report | Referring Site Report | Browser Report | Browser Summary | Operating System Report | Status Code Report | File Size Report | File Type Report | Directory Report | Request Report)
Listing referring URLs, sorted by the number of failed requests.
| #reqs | URL |
|---|---|
| 1 | http://blog.soshiaweb.ir/phpmyadmin/index.php |
(Go To: Top | General Summary | Monthly Report | Daily Summary | Hourly Summary | Domain Report | Organization Report | Redirected Referrer Report | Failed Referrer Report | Referring Site Report | Browser Report | Browser Summary | Operating System Report | Status Code Report | File Size Report | File Type Report | Directory Report | Request Report)
Listing referring sites, sorted by the number of requests.
| #reqs | site |
|---|---|
| 4 | http://blog.soshiaweb.ir/ |
(Go To: Top | General Summary | Monthly Report | Daily Summary | Hourly Summary | Domain Report | Organization Report | Redirected Referrer Report | Failed Referrer Report | Referring Site Report | Browser Report | Browser Summary | Operating System Report | Status Code Report | File Size Report | File Type Report | Directory Report | Request Report)

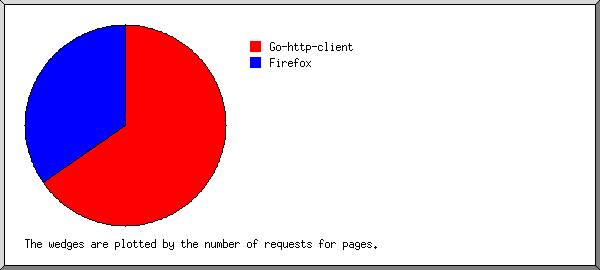
Listing browsers with at least 1 request for a page, sorted by the number of requests for pages.
| #reqs | #pages | browser |
|---|---|---|
| 15 | 15 | Go-http-client/1.1 |
| 8 | 8 | Mozilla/5.0 (X11; Fedora; Linux x86_64; rv:94.0) Gecko/20100101 Firefox/95.0 |
| 696 | 0 | [not listed: 10 browsers] |
(Go To: Top | General Summary | Monthly Report | Daily Summary | Hourly Summary | Domain Report | Organization Report | Redirected Referrer Report | Failed Referrer Report | Referring Site Report | Browser Report | Browser Summary | Operating System Report | Status Code Report | File Size Report | File Type Report | Directory Report | Request Report)
Listing browsers with at least 1 request for a page, sorted by the number of requests for pages.
| # | #reqs | #pages | browser |
|---|---|---|---|
| 1 | 15 | 15 | Go-http-client |
| 15 | 15 | Go-http-client/1 | |
| 2 | 8 | 8 | Firefox |
| 8 | 8 | Firefox/95 | |
| 696 | 0 | [not listed: 4 browsers] |
(Go To: Top | General Summary | Monthly Report | Daily Summary | Hourly Summary | Domain Report | Organization Report | Redirected Referrer Report | Failed Referrer Report | Referring Site Report | Browser Report | Browser Summary | Operating System Report | Status Code Report | File Size Report | File Type Report | Directory Report | Request Report)
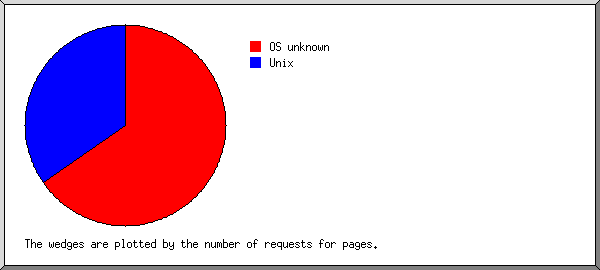
Listing operating systems, sorted by the number of requests for pages.
| # | #reqs | #pages | OS |
|---|---|---|---|
| 1 | 709 | 15 | OS unknown |
| 2 | 8 | 8 | Unix |
| 8 | 8 | Linux | |
| 3 | 2 | 0 | Windows |
| 2 | 0 | Windows NT |
(Go To: Top | General Summary | Monthly Report | Daily Summary | Hourly Summary | Domain Report | Organization Report | Redirected Referrer Report | Failed Referrer Report | Referring Site Report | Browser Report | Browser Summary | Operating System Report | Status Code Report | File Size Report | File Type Report | Directory Report | Request Report)
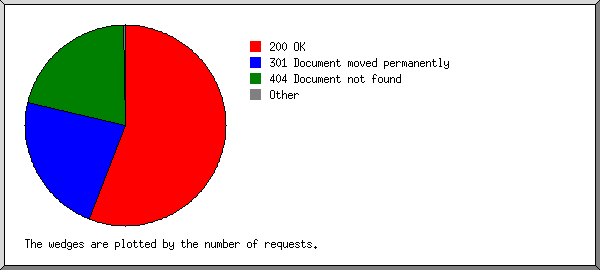
Listing status codes, sorted numerically.
| #reqs | status code |
|---|---|
| 719 | 200 OK |
| 296 | 301 Document moved permanently |
| 4 | 302 Document found elsewhere |
| 271 | 404 Document not found |
(Go To: Top | General Summary | Monthly Report | Daily Summary | Hourly Summary | Domain Report | Organization Report | Redirected Referrer Report | Failed Referrer Report | Referring Site Report | Browser Report | Browser Summary | Operating System Report | Status Code Report | File Size Report | File Type Report | Directory Report | Request Report)
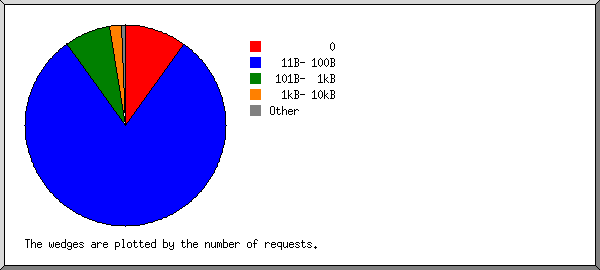
| size | #reqs | %bytes |
|---|---|---|
| 0 | 72 | |
| 1B- 10B | 0 | |
| 11B- 100B | 576 | 27.60% |
| 101B- 1kB | 53 | 5.11% |
| 1kB- 10kB | 14 | 17.75% |
| 10kB-100kB | 4 | 49.55% |
(Go To: Top | General Summary | Monthly Report | Daily Summary | Hourly Summary | Domain Report | Organization Report | Redirected Referrer Report | Failed Referrer Report | Referring Site Report | Browser Report | Browser Summary | Operating System Report | Status Code Report | File Size Report | File Type Report | Directory Report | Request Report)
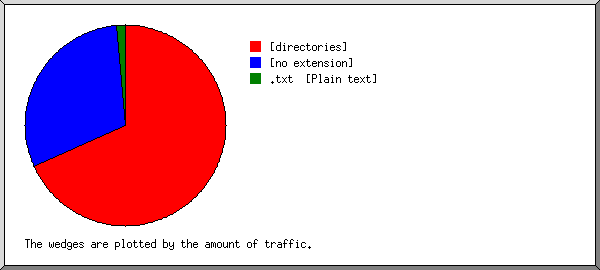
Listing extensions with at least 0.1% of the traffic, sorted by the amount of traffic.
| #reqs | %bytes | extension |
|---|---|---|
| 23 | 68.26% | [directories] |
| 611 | 30.30% | [no extension] |
| 13 | 1.43% | .txt [Plain text] |
| 72 | [not listed: 1 extension] |
(Go To: Top | General Summary | Monthly Report | Daily Summary | Hourly Summary | Domain Report | Organization Report | Redirected Referrer Report | Failed Referrer Report | Referring Site Report | Browser Report | Browser Summary | Operating System Report | Status Code Report | File Size Report | File Type Report | Directory Report | Request Report)
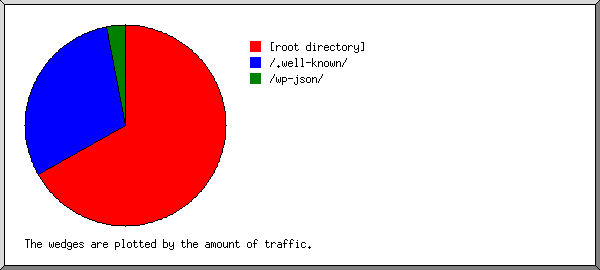
Listing directories with at least 0.01% of the traffic, sorted by the amount of traffic.
| #reqs | %bytes | directory |
|---|---|---|
| 104 | 66.79% | [root directory] |
| 611 | 30.30% | /.well-known/ |
| 4 | 2.90% | /wp-json/ |
(Go To: Top | General Summary | Monthly Report | Daily Summary | Hourly Summary | Domain Report | Organization Report | Redirected Referrer Report | Failed Referrer Report | Referring Site Report | Browser Report | Browser Summary | Operating System Report | Status Code Report | File Size Report | File Type Report | Directory Report | Request Report)
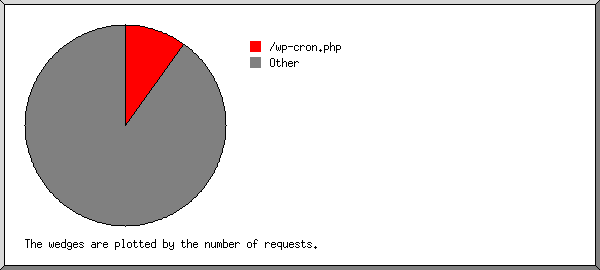
Listing files with at least 20 requests, sorted by the number of requests.
| #reqs | %bytes | last time | file |
|---|---|---|---|
| 72 | Aug/ 2/24 11:32 AM | /wp-cron.php | |
| 647 | 100% | Nov/ 8/24 1:48 AM | [not listed: 539 files] |